You’ve probably heard of website analytics and maybe even know a few rules-of-thumb for stats like “bounce rate” or “conversion rate.” But what do these terms even mean? And what do you do with them? To help, we’ve boiled it all down to the metrics that truly matter.
Website and Marketing Performance
When you are reviewing your analytics, it is important to understand what stats are actually relevant and what you should do with them. When it comes to your website and the quality of your content and your navigation, these are the stats that matter:
Tip: Generally speaking, you want to examine your website’s visitor “behavior” statistics when reviewing the performance of your website & marketing.
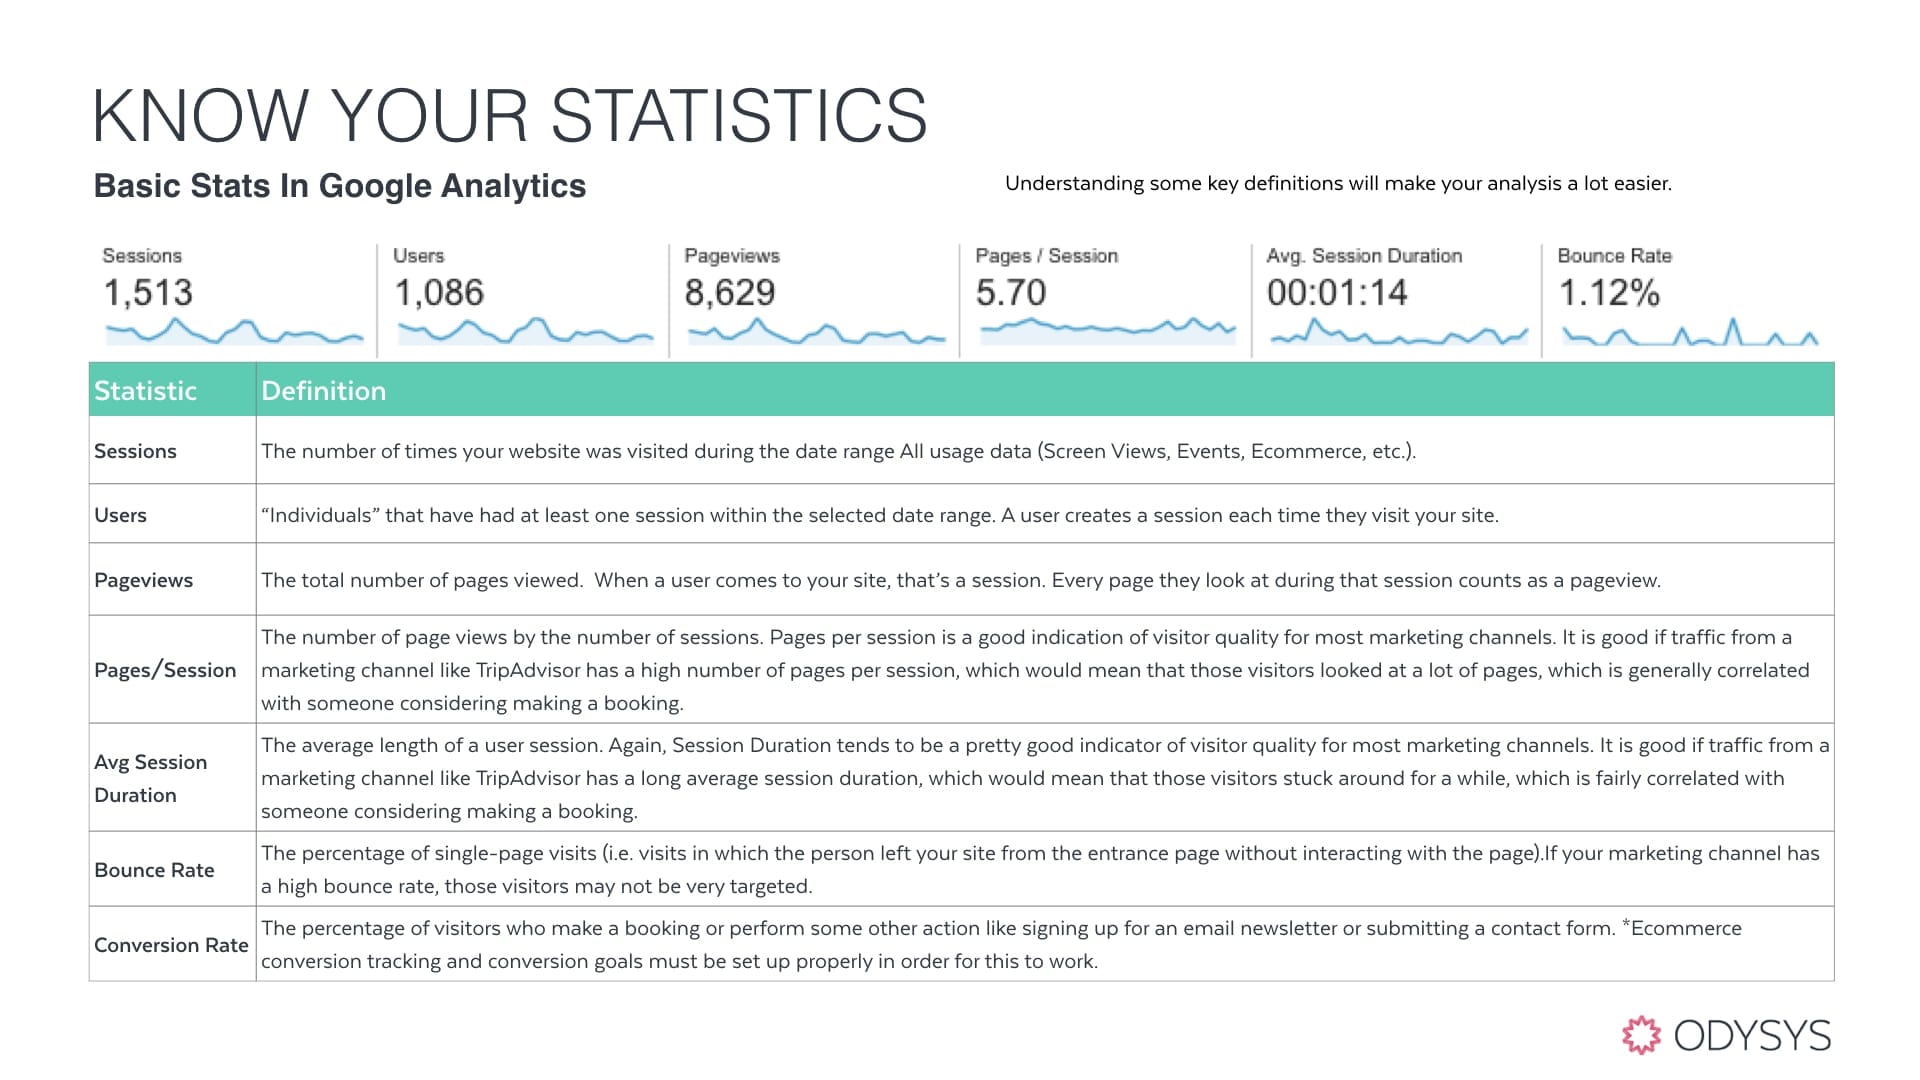 From the Odysys Guide Google Analytics for Innkeepers:
eCommerce Conversion Rate
In this section I’m referring specifically to your website’s eCommerce Conversion Rate. You can also set up conversion goals for things like contact form submissions or email newsletter signups etc.
Conversion rates can vary wildly for websites depending on the amount of traffic they get, the sources of that traffic, and other factors. The typical conversion rate is somewhere between 1%-3% but that really depends on what types of marketing you do and how much traffic you get to your website as a result. If you are getting good traffic but struggling with conversion rate, consider adding more CTAs (Calls to Action) or improving your site’s content (ie. copy, images, formatting, design, etc.). But the real driver of conversion rate is your booking engine. If it doesn’t work well, doesn’t represent your property well, is difficult to use especially on mobile devices, then you may need to make a change.
It is ultimately more enlightening to look at your conversion rate by traffic source (“Channel” or “Source/Medium”) and also by landing page. A visitor landing on your home page from Google is probably more likely to book than someone who lands on a blog post about the best coffee shops in the area that you shared in social media.
Visitor Behavior & Conversion
As you have probably figured out, you want a low bounce rate, a low exit rate, a high time on site, a high number of pages viewed, and a high conversion rate.
Here’s what you can do with these statistics:
- Evaluate the quality of traffic coming from various sources. You can look at these behavior statistics when comparing your marketing efforts. For example, if you are paying for a listing on two different websites, and the traffic from one site demonstrates much better behavior or conversion statistics than the other, you would want to think about shifting more of your marketing dollars to the better performing site.
- Evaluate whether a change you made to a page has helped or hurt. If you’ve made a change to a page on your site, or redesigned your website, and the behavior stats improve after those changes, you can pat yourself on the back for a job well done.
- Identify problem pages on your website. Review the pages on your site and look at your exit rate for those pages vs the average. Determine why some pages may have a higher exit rate than the others.
Sometimes there’s a good reason for a high exit rate. For example, the final page in the booking process or a page with a lot of links to other sites on it (such as a blog post) could have a high exit rate. Your room/accommodations page should have a low exit rate compared to other pages on your site.
What’s a Good (or Bad) Bounce Rate?
This is a loaded question. There are definitely a few rules of thumb to be aware of. Generally speaking, your website’s overall bounce rate should be below 30%-35%. But that doesn’t tell the whole story. It is usually best to evaluate bounce rate by traffic source and then compare those sources. Sometimes one source of traffic will skew the entire mix with a really high bounce rate. This also assumes that Google Analytics is properly configured on your booking engine (see “Things to Keep in Mind” below).
When evaluating your bounce rate by channel, I recommend using these guidelines:
- Organic search traffic: Below 30% UNLESS you’ve got a lot of blog content that brings in a high amount of traffic. If that’s the case, drill into your organic search traffic by landing page and look at conversion rate for Organic Search traffic to your home page. But if your website contains a simple homepage, room/accommodation pages, and the other four pages every B&B site needs to have, the bounce rate should be well below 30%.
- Referral Traffic: Below 35%
- Direct Traffic: Tends to be higher, so don’t worry about it. It might remain high if you don’t filter yourself out. Otherwise, direct traffic tends to be “task-oriented,” such as users looking for your contact info.
- Paid traffic (AdWords, Banner Ads, Facebook Ads, etc): Tends to bounce at a much higher rate. Evaluate this traffic from an ROI perspective instead
- Social traffic: Tends to bounce at a much higher rate as well. Think about it – if you’re on your facebook app on your phone and you click a link in a post. You tend to just look at the content and leave. This is normal.
Booking Engine Performance
The Booking Engine is perhaps the most important part of your site because it does the necessary work of placing reservations, taking guest information, and possibly accepting payments or deposits. Your Booking Engine needs to be streamlined and well-designed. Users will leave if it takes too many steps to book or get the desired information (like availability and rates for a certain date range). Don’t lose an important booking just because your booking engine is out of date or isn’t mobile friendly. To analyze the strength of your booking engine, take a look at:
- Ecommerce Conversion Rate: The Ecommerce conversion rate is a direct reflection of your booking engine’s ability to convert visitors into guests. As a general rule, 1% is an ‘average’ target but again, it is best to evaluate by traffic source. For example: Organic search traffic should convert at a higher rate than that and social traffic typically doesn’t have a good conversion rate at all. Changing your traffic mix will change your conversion rate (i.e-focusing on generating more traffic from higher converting sources). Changes to your website and booking engine will also have an affect. If you are struggling, consider adding more CTAs (Calls to Action) or improving your site’s content (ie. copy, pictures, SEO etc.) or pricing strategy.
- Transactions: Keep track of the number of online transactions on a year-to-year basis. If you find the number of transactions falling, look back at the data from last year to see where visitors were coming from and how they interacted with your site once they were there. This may give you a better idea of which pages to improve or add to your site, what content to edit, and how to better optimize each page of your site.
- Revenue: If you feel that revenue is down, be creative in ways you can improve income and sales. This might mean adding extras or add-ons to your booking engine. It might also mean taking a look at your pricing strategy.
Tips and Tricks
Google Analytics will let you segment visitors. There are some fancy ways to use advanced segments, but the easiest thing to do is to just check out Google Analytics “Audience” reporting.
- Check out the Geo > Location reporting to see performance of your website for US visitors only
- Check out Mobile reports (Audience > Mobile) to see how your website is performing for mobile visitors
- If you’ve got ecommerce reporting working, check out the conversions > ecommerce reports.
- Go to Conversions > Multi-Channel Funnels > Assisted Conversions. Click on “First Interaction Analysis” for a view of how your guests are finding your website in the first place. By default, Google conversion reporting shows you the last way someone got to your website before converting. But there’s also a way to see how they FIRST got to your website up to 90 days prior to converting.
Things to Keep In Mind
There are a few caveats to all of this.
- If your booking engine doesn’t have Google Analytics setup then your behavior and conversion stats will not be reliable. Bounce and exit rate will be inflated. Time on site and pages viewed will be artificially low.
- If your booking engine and website aren’t properly setup for cross domain tracking then your stats will be unreliable. Tell-tale signs are self-referrals in your google analytics (ie – your own domain name shows up as a source of traffic) and/or your bookings primarily come through as “direct.”
- If your website and booking engine aren’t mobile friendly, this will also have a negative effect that might not be fully reflected in these metrics.
It might be time to do a little spring cleaning on your hotel or B&B website. Take a look at these essential metrics to see where your website is thriving and what parts might be holding it back from performing at its highest level.
To learn information more about the ins and outs of Google Analytics, download our Innkeeper Guide below.